Hi! I’m trying to record sensor data from some IcubeX sensors that are connected by midi to software running on my Mac. I’m outputting OSC Data on local host and trying to record that in 2. The OSC message string looks a bit unusual but its showing up in messages ok… but there no message values when I try to record! Any tips would be be hugely appreciated!
16:56:02.759 | RECEIVE | ENDPOINT([::ffff:127.0.0.1]:50950) ADDRESS(Red) FLOAT(50.262424)
16:56:02.759 | RECEIVE | ENDPOINT([::ffff:127.0.0.1]:50950) ADDRESS(IR) FLOAT(48.964428)
16:56:02.759 | RECEIVE | ENDPOINT([::ffff:127.0.0.1]:50950) ADDRESS(T) FLOAT(23.6875)
1 Like
Hi and welcome!
First things first, you know that TWO can record MIDI directly - and then you can map that to OSC in a Matrix, right? Now with that out of the way:
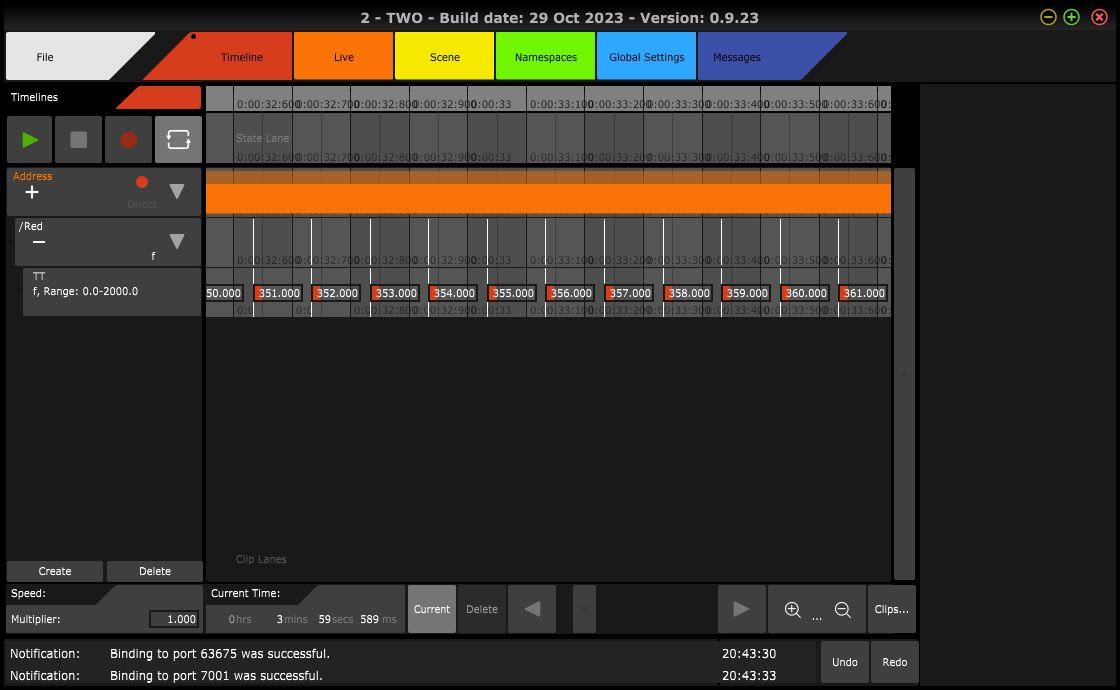
The messages you pasted look like they came from Protokol, but I’m guessing they look the same in TWO’s messages tab (the last one) judging by what you say.
What I see is that strictly, the OSC message is malformed - the “Address Pattern” is not preceded by a forward slash.
I also did a quick test on my computer to confirm - I created a little Max patch sending a message like yours, sending an OSC message “Red, f” to TWO. Indeed it appeared in the Messages view, and failed to record.
A simple change fixed that though - just add a “/” to your OSC Address Pattern and you’re golden!
So, instead of “Red, f”, it should be “/Red, f”.
With that, TWO was recording without problem.
Strictly, not having a “/” starting your OSC Address Pattern means your OSC message doesn’t follow the OSC standard - but of course I could change TWO to tolerate a missing first “/” if it happens to get such a message.
Until I do that though, the above change to your OSC source should be all you need!
Best,
Ilias B.
I’m curious to see what you’re making, do post back when you’ve something to show!
Hi Ilias,
Thanks so much for looking into it for me. I’ll test it out this evening and hopefully it will resolve the problem. I’m trying to make a sensor data recorder that can play back OSC files for performance but also get the data out to Excel / Matlab for signal analysis… It looks like 2 will be ideal for recording the data and then we’ll probably use ProtoKol to “listen” to the playback and cut and paste the file for further analysis (unless there’s a way to export clips or tracks to .txt file?)
I didn’t realise you could translate MIDI to OSC using the matrix - I’m still trying to get my head around the matrix part of your software - I’ll take a look!
Thanks a million,
David
Glad to be of help!
TWO doesn’t have a way of exporting to txt I’m afraid - although the project file is XML, it’s not as easy to parse as just the Protokol output, so for what you need to do I think your strategy is your best bet.
The MIDI implementation in TWO is such that either you can just immediately create a “Midi Address” in the Scene tab, and if you want detailed mapping natively in the namespace between what MIDI messages map to what OSC, you can also create a “MIDI Namespace” in the Namespaces tab, which you then pick in the “MIDI Address”'s property panel.
Best,
Ilias B.
Oh, I forgot - if you just want to record all messages coming in, without managing the clips, editing the data, etc, you can also use the “Recorder”, which you will find in the pop-up appearing if you click “Create” in the Controllers section of the Live tab.
It works!!! Thanks for your help!
I also changed the method the OSC sensor values were being sent to 2 and now the timeline recording and the Recorder you mentioned are both working. I’m seeing a lot of crashing at the moment but from reading the forum it’s most likely caused by too high data rates from the sensors.
Is there a way to recover a crashed file that saves the recorded data? It would be great to be able to save the clips as a sort of backup while you work so that even in the event of a crash the clips could be reloaded. Or maybe a way to load or import timestamped data from ProtoKol?
I’ll work on changing the sensor data rates which will hopefully help! We’re recording biometric data from sensors so high data rates are necessary to retain detail in the recordings, so it’s a case of finding the right balance!
1 Like
Here’s an example of a crash report… 2 crashed while moving through screen checking settings - no incoming data stream from sensors …
Translated Report (Full Report Below)
Process: TWO [4406]
Path: /Applications/TWO/TWO.app/Contents/MacOS/TWO
Identifier: com.coma.TWO
Version: 0.9.22 (0.9.22)
Code Type: X86-64 (Translated)
Parent Process: launchd [1]
User ID: 501
Date/Time: 2023-11-01 08:41:59.3325 +0000
OS Version: macOS 14.0 (23A344)
Report Version: 12
Anonymous UUID: 44F662A2-D131-7F9D-20AE-F2417B7724D9
Sleep/Wake UUID: 69EB4B25-3140-4BB1-B364-4E3A78EB828C
Time Awake Since Boot: 34000 seconds
Time Since Wake: 471 seconds
System Integrity Protection: enabled
Notes:
PC register does not match crashing frame (0x0 vs 0x10106B8AF)
Crashed Thread: 0 JUCE Message Thread Dispatch queue: com.apple.main-thread
Exception Type: EXC_BAD_ACCESS (SIGSEGV)
Exception Codes: KERN_INVALID_ADDRESS at 0x8000000000000040 → 0x0000000000000040 (possible pointer authentication failure)
Exception Codes: 0x0000000000000001, 0x8000000000000040
Termination Reason: Namespace SIGNAL, Code 11 Segmentation fault: 11
Terminating Process: exc handler [4406]
VM Region Info: 0x40 is not in any region. Bytes before following region: 140723069910976
REGION TYPE START - END [ VSIZE] PRT/MAX SHRMOD REGION DETAIL
UNUSED SPACE AT START
—>
mapped file 7ffca4980000-7ffcca0a0000 [599.1M] r-x/r-x SM=COW …t_id=c7b8fbcb
Error Formulating Crash Report:
PC register does not match crashing frame (0x0 vs 0x10106B8AF)
Thread 0 Crashed:: JUCE Message Thread Dispatch queue: com.apple.main-thread
0 TWO 0x10106b8af 0x100d71000 + 3123375
1 TWO 0x10106ae8a 0x100d71000 + 3120778
2 TWO 0x10102c3a1 0x100d71000 + 2864033
3 TWO 0x100ff8643 0x100d71000 + 2651715
4 TWO 0x10106af98 0x100d71000 + 3121048
5 TWO 0x100fa8184 0x100d71000 + 2322820
6 CoreFoundation 0x7ff81004ca26 CFRUNLOOP_IS_CALLING_OUT_TO_A_SOURCE0_PERFORM_FUNCTION + 17
7 CoreFoundation 0x7ff81004c9c9 __CFRunLoopDoSource0 + 157
8 CoreFoundation 0x7ff81004c798 __CFRunLoopDoSources0 + 215
9 CoreFoundation 0x7ff81004b408 __CFRunLoopRun + 919
10 CoreFoundation 0x7ff81004aa69 CFRunLoopRunSpecific + 557
11 HIToolbox 0x7ff81ad7c9d9 RunCurrentEventLoopInMode + 292
12 HIToolbox 0x7ff81ad7c7e6 ReceiveNextEventCommon + 665
13 HIToolbox 0x7ff81ad7c531 _BlockUntilNextEventMatchingListInModeWithFilter + 66
14 AppKit 0x7ff8135b40c5 _DPSNextEvent + 880
15 AppKit 0x7ff813ea5150 -[NSApplication(NSEventRouting) _nextEventMatchingEventMask:untilDate:inMode:dequeue:] + 1304
16 AppKit 0x7ff8135a563a -[NSApplication run] + 603
17 TWO 0x100f4987c 0x100d71000 + 1935484
18 dyld 0x2014d53a6 start + 1942
Thread 1:: com.apple.rosetta.exceptionserver
0 runtime 0x7ff7ffc712b4 0x7ff7ffc6d000 + 17076
Thread 2:: Mediator Thread
0 ??? 0x7ff8a0322a78 ???
1 libsystem_kernel.dylib 0x7ff80ff345d6 __psynch_cvwait + 10
2 libsystem_pthread.dylib 0x7ff80ff7176b _pthread_cond_wait + 1211
3 libc++.1.dylib 0x7ff80fea93c2 std::__1::condition_variable::wait(std::__1::unique_lockstd::__1::mutex&) + 18
4 TWO 0x100f704e0 0x100d71000 + 2094304
5 TWO 0x100f26dba 0x100d71000 + 1793466
6 TWO 0x100f7bc06 0x100d71000 + 2141190
7 libsystem_pthread.dylib 0x7ff80ff71202 _pthread_start + 99
8 libsystem_pthread.dylib 0x7ff80ff6cbab thread_start + 15
Thread 3:: OSC_Listener Thread
0 ??? 0x7ff8a0322a78 ???
1 libsystem_kernel.dylib 0x7ff80ff3884e poll + 10
2 TWO 0x100f1cccc 0x100d71000 + 1752268
3 TWO 0x100f7bc06 0x100d71000 + 2141190
4 libsystem_pthread.dylib 0x7ff80ff71202 _pthread_start + 99
5 libsystem_pthread.dylib 0x7ff80ff6cbab thread_start + 15
Thread 4:: caulk.messenger.shared:17
0 ??? 0x7ff8a0322a78 ???
1 libsystem_kernel.dylib 0x7ff80ff319aa semaphore_wait_trap + 10
2 caulk 0x7ff81aa9bc7e caulk::semaphore::timed_wait(double) + 150
3 caulk 0x7ff81aa9bb98 caulk::concurrent::details::worker_thread::run() + 30
4 caulk 0x7ff81aa9b8bc void* caulk::thread_proxy<std::__1::tuple<caulk:![]() :attributes, void (caulk::concurrent::details::worker_thread::)(), std::__1::tuplecaulk::concurrent::details::worker_thread*>>(void) + 41
:attributes, void (caulk::concurrent::details::worker_thread::)(), std::__1::tuplecaulk::concurrent::details::worker_thread*>>(void) + 41
5 libsystem_pthread.dylib 0x7ff80ff71202 _pthread_start + 99
6 libsystem_pthread.dylib 0x7ff80ff6cbab thread_start + 15
Thread 5:: caulk.messenger.shared:high
0 ??? 0x7ff8a0322a78 ???
1 libsystem_kernel.dylib 0x7ff80ff319aa semaphore_wait_trap + 10
2 caulk 0x7ff81aa9bc7e caulk::semaphore::timed_wait(double) + 150
3 caulk 0x7ff81aa9bb98 caulk::concurrent::details::worker_thread::run() + 30
4 caulk 0x7ff81aa9b8bc void* caulk::thread_proxy<std::__1::tuple<caulk:![]() :attributes, void (caulk::concurrent::details::worker_thread::)(), std::__1::tuplecaulk::concurrent::details::worker_thread*>>(void) + 41
:attributes, void (caulk::concurrent::details::worker_thread::)(), std::__1::tuplecaulk::concurrent::details::worker_thread*>>(void) + 41
5 libsystem_pthread.dylib 0x7ff80ff71202 _pthread_start + 99
6 libsystem_pthread.dylib 0x7ff80ff6cbab thread_start + 15
Thread 6:: com.apple.NSEventThread
0 ??? 0x7ff8a0322a78 ???
1 libsystem_kernel.dylib 0x7ff80ff31a2e mach_msg2_trap + 10
2 libsystem_kernel.dylib 0x7ff80ff3fe4a mach_msg2_internal + 84
3 libsystem_kernel.dylib 0x7ff80ff38b6e mach_msg_overwrite + 653
4 libsystem_kernel.dylib 0x7ff80ff31d1f mach_msg + 19
5 CoreFoundation 0x7ff81004cb59 __CFRunLoopServiceMachPort + 143
6 CoreFoundation 0x7ff81004b5cc __CFRunLoopRun + 1371
7 CoreFoundation 0x7ff81004aa69 CFRunLoopRunSpecific + 557
8 AppKit 0x7ff8137113e0 _NSEventThread + 122
9 libsystem_pthread.dylib 0x7ff80ff71202 _pthread_start + 99
10 libsystem_pthread.dylib 0x7ff80ff6cbab thread_start + 15
Thread 7:: JUCE Timer
0 ??? 0x7ff8a0322a78 ???
1 libsystem_kernel.dylib 0x7ff80ff345d6 __psynch_cvwait + 10
2 libsystem_pthread.dylib 0x7ff80ff7176b _pthread_cond_wait + 1211
3 libc++.1.dylib 0x7ff80fea944b std::__1::condition_variable::__do_timed_wait(std::__1::unique_lockstd::__1::mutex&, std::__1::chrono::time_point<std::__1::chrono::system_clock, std::__1::chrono::duration<long long, std::__1::ratio<1l, 1000000000l>>>) + 93
4 TWO 0x100f704a2 0x100d71000 + 2094242
5 TWO 0x100faa5e4 0x100d71000 + 2332132
6 TWO 0x100f7bc06 0x100d71000 + 2141190
7 libsystem_pthread.dylib 0x7ff80ff71202 _pthread_start + 99
8 libsystem_pthread.dylib 0x7ff80ff6cbab thread_start + 15
Thread 8:: OSC_Listener Thread
0 ??? 0x7ff8a0322a78 ???
1 libsystem_kernel.dylib 0x7ff80ff3884e poll + 10
2 TWO 0x100f1cccc 0x100d71000 + 1752268
3 TWO 0x100f7bc06 0x100d71000 + 2141190
4 libsystem_pthread.dylib 0x7ff80ff71202 _pthread_start + 99
5 libsystem_pthread.dylib 0x7ff80ff6cbab thread_start + 15
Thread 9:: Recorder Thread
0 ??? 0x7ff8a0322a78 ???
1 libsystem_kernel.dylib 0x7ff80ff345d6 __psynch_cvwait + 10
2 libsystem_pthread.dylib 0x7ff80ff7176b _pthread_cond_wait + 1211
3 libc++.1.dylib 0x7ff80fea93c2 std::__1::condition_variable::wait(std::__1::unique_lockstd::__1::mutex&) + 18
4 TWO 0x100f704e0 0x100d71000 + 2094304
5 TWO 0x100eb2e85 0x100d71000 + 1318533
6 TWO 0x100f7bc06 0x100d71000 + 2141190
7 libsystem_pthread.dylib 0x7ff80ff71202 _pthread_start + 99
8 libsystem_pthread.dylib 0x7ff80ff6cbab thread_start + 15
Thread 10:
0 runtime 0x7ff7ffc8f94c 0x7ff7ffc6d000 + 141644
Thread 11:
0 runtime 0x7ff7ffc8f94c 0x7ff7ffc6d000 + 141644
Thread 12:
0 runtime 0x7ff7ffc8f94c 0x7ff7ffc6d000 + 141644
Thread 0 crashed with X86 Thread State (64-bit):
rax: 0x8000000000000000 rbx: 0x00007fc07d8d5d48 rcx: 0x0000600002f447c0 rdx: 0x0000000000000000
rdi: 0x0000600002f447e8 rsi: 0x00007fc07d8d5d48 rbp: 0x00000003063461a0 rsp: 0x0000000306346110
r8: 0x0000000000000004 r9: 0x00000000000007fb r10: 0x0000000000000100 r11: 0x0000000000000007
r12: 0x00007fc0de61f380 r13: 0x0000600002f447e8 r14: 0x0000600002f44700 r15: 0x0000000306346128
rip: rfl: 0x0000000000000202
tmp0: 0x000000010106b813 tmp1: 0x000000010106b813 tmp2: 0x0000000101742480
Binary Images:
0x2014cf000 - 0x20156efff dyld () <1289b60a-4980-342d-b1a4-250bbee392f1> /usr/lib/dyld
0x10a1e0000 - 0x10a1effff libobjc-trampolines.dylib () <71d6744a-feb5-33e6-be9b-3a2258cf6f23> /usr/lib/libobjc-trampolines.dylib
0x10a6f9000 - 0x10aa43fff libossia.dylib () <33c5fa5c-5bb5-37c8-a786-62bbb4ea079f> /Applications/TWO/TWO.app/Contents/Frameworks/libossia.dylib
0x10a49e000 - 0x10a4e9fff org.sparkle-project.Sparkle (1.26.0) <7ea2139c-de4a-35ce-8ddb-c37fbdb6bf52> /Applications/TWO/TWO.app/Contents/Frameworks/Sparkle.framework/Versions/A/Sparkle
0x7ff7ffc6d000 - 0x7ff7ffc9cfff runtime () <31538c50-034b-3469-ae9f-0fffbd6f4de1> /usr/libexec/rosetta/runtime
0x109910000 - 0x109963fff libRosettaRuntime () <29e3f175-b88d-3239-bd82-326cde98f820> /Library/Apple//libRosettaRuntime
0x100d71000 - 0x101188fff com.coma.TWO (0.9.22) /Applications/TWO/TWO.app/Contents/MacOS/TWO
0x7ff80ffd0000 - 0x7ff810468ffc com.apple.CoreFoundation (6.9) /System/Library/Frameworks/CoreFoundation.framework/Versions/A/CoreFoundation
0x7ff81ad4c000 - 0x7ff81afe7ff4 com.apple.HIToolbox (2.1.1) /System/Library/Frameworks/Carbon.framework/Versions/A/Frameworks/HIToolbox.framework/Versions/A/HIToolbox
0x7ff813575000 - 0x7ff814976fff com.apple.AppKit (6.9) <70a55260-7bb1-3c07-aac3-402d42fa9913> /System/Library/Frameworks/AppKit.framework/Versions/C/AppKit
0x0 - 0xffffffffffffffff ??? () <00000000-0000-0000-0000-000000000000> ???
0x7ff80ff30000 - 0x7ff80ff6aff7 libsystem_kernel.dylib () <3690c1fc-599f-39ff-bbdb-85422e9a996c> /usr/lib/system/libsystem_kernel.dylib
0x7ff80ff6b000 - 0x7ff80ff76fff libsystem_pthread.dylib () <33c43114-85f0-3f32-86d7-8e6a2403d38c> /usr/lib/system/libsystem_pthread.dylib
0x7ff80fe98000 - 0x7ff80ff16fff libc++.1.dylib () <1d0eb230-4aae-3d78-94c8-3592266667f6> /usr/lib/libc++.1.dylib
0x7ff81aa9a000 - 0x7ff81aabfff3 com.apple.audio.caulk (1.0) <2fa94fa9-2cc7-3d7e-b680-46f46aa084c8> /System/Library/PrivateFrameworks/caulk.framework/Versions/A/caulk
External Modification Summary:
Calls made by other processes targeting this process:
task_for_pid: 0
thread_create: 0
thread_set_state: 0
Calls made by this process:
task_for_pid: 0
thread_create: 0
thread_set_state: 0
Calls made by all processes on this machine:
task_for_pid: 0
thread_create: 0
thread_set_state: 0
VM Region Summary:
ReadOnly portion of Libraries: Total=822.4M resident=0K(0%) swapped_out_or_unallocated=822.4M(100%)
Writable regions: Total=2.3G written=0K(0%) resident=0K(0%) swapped_out=0K(0%) unallocated=2.3G(100%)
VIRTUAL REGION
REGION TYPE SIZE COUNT (non-coalesced)
=========== ======= =======
Accelerate framework 256K 2
Activity Tracing 256K 1
CG image 12K 1
ColorSync 236K 30
CoreAnimation 164K 17
CoreGraphics 12K 2
CoreUI image data 952K 5
Foundation 16K 1
Kernel Alloc Once 8K 1
MALLOC 2.1G 80
MALLOC guard page 384K 24
Rosetta Arena 4096K 2
Rosetta Generic 1240K 307
Rosetta IndirectBranch 1024K 1
Rosetta JIT 128.0M 1
Rosetta Return Stack 240K 24
Rosetta Thread Context 240K 24
STACK GUARD 12K 3
Stack 13.6M 12
Stack Guard 56.0M 9
VM_ALLOCATE 6008K 25
VM_ALLOCATE (reserved) 4K 1 reserved VM address space (unallocated)
__CTF 824 1
__DATA 34.1M 555
__DATA_CONST 36.9M 353
__DATA_DIRTY 1605K 202
__FONT_DATA 2352 1
__LINKEDIT 178.1M 11
__OBJC_RO 70.5M 1
__OBJC_RW 2151K 2
__TEXT 644.3M 574
dyld private memory 260K 2
mapped file 6.9G 848
shared memory 2856K 16
unshared pmap 13.0M 9
=========== ======= =======
TOTAL 10.2G 3148
TOTAL, minus reserved VM space 10.2G 3148
Hi!
I just made a new release yesterday - just out of coincidence - version 0.9.23.
This might be more stable than the one you have. It’s available on the downloads page.
Indeed if you have an extremely high data rate, TWO will not like it. right now I forget if I added some capping in the code since it happened to the previous reporter (I will check later, today I’m unable to).
I DEFINITELY changed it so that it doesn’t try to draw each and every single keyframe received until after recording. But if it’s many thousands it may still be choking.
Your best bet is to reduce it to ~40Hz - also for your own purposes later, apart from the instability it causes.
IIRC the Recorder will be the more efficient one here, in that it doesn’t do any drawing of the data.
The MacOS build, unfortunately is made in a painfully slow windows VM, meaning I’m not able to test it as much as the Windows version I’m afraid. I’ll need to buy a mac and start working on debugging TWO on it properly to address this.
There’s no way to recover if what you say happens, that the program has gigabytes of RAM allocated and runs out.
Best,
Ilias B.
Ok great! I’ll try the new version and see how it goes! I’ll also reduce the sample rate as suggested.
Thanks for the help and suggestions!
David
Unless I misinterpret your crashlog, the TWO instance uses 10.2G of RAM(!), can that really be true?
I took a quick minute to do a test with a high datarate recording, i.e. a message once every 5 milliseconds, meaning 50.000 messages in 4 minutes.
That loads and saves cleanly, and results in a file of “only” 5MB.
I’ve uploaded the TWO project here.
With that loaded, TWO uses 290MB of RAM.
Now, that clip cannot be edited in the editing lane, I will need to work on optimizing the drawing of so very many keys. But if you don’t add an “editing lane” it should be fine - see the attached file.
It’s hard to tell from the crashlog, as least for me as primarily a Windows dev. But if you can confirm from your “Task Manager” / “Process Monitor” the RAM usage of TWO when it crashes, that will be an indication on whether the issue is indeed data-rate related. 10.2GB is a LOT of messages, if 50.000 is 290MB ![]() .
.
50000.zip (517.2 KB)
And another test:
2 message streams in parallel, each new message pair arriving at 1ms intervals(!).
So, 100.000 messages over 2 minutes. At least on windows that’s fine, not much ram, and the program is responsive.
100000.zip (1.0 MB)
I’m very curious about your data-rate now!
Ahh. there must be another issue… there’s no way I’m sending that much data! I’ll have a look at the task manger and report back!
Tested the system again using the new version… sending data at 10ms intervals (3 lines of data per interval) I’m seeing less than 200mb of memory use… pushed it to 1ms and it peaked around 300mb!
Looks to be fixed! They were short recordings at around 10-15 seconds but it looks good!
I’ll try some complex routing and processing tomorrow (once I figure out how that works ![]() and see… but so far so good!
and see… but so far so good!
1 Like
Great,
Keep me posted in case anything else crops up, fingers crossed with this update you should be A OK!
Hi! So new problems! Might just be a Mac issue I guess. When I record a clip in a file and close the file, it can’t be reopened. Ill try to attach an example file here
Can’t attach the file - is there a support email I can send it to? Thanks,
David
Hi, sorry to hear, definitely send me the file!
That should not be a mac issue specifically, not that I can think of.
If you zip it you should be able to attach, unless it’s very large?
Either way, send it to onar3d at gmail dot com and I will take a look!
Obviously from the above two linked files it worked with timelines - I tried with the “Recorder” as well now just in case anything has broken recently, that worked for me too, so absolutely do send me the file.
Meanwhile - Have you tried both with timelines, as per the example, and the Recorder? Internally they are completely different, while both worked on my end, if there’s a bug it will most likely appear in one of the two, not both.
Since I’m stuck at home recovering from Covid on a Saturday night, I did some more testing on constant-high-rate stream recording.
My usual use-case has been over the duration of a song, so 5-15 mins, and while I’ve had complex namespaces, and momentarily high rates, it’s not been full-on data, “all stops out” for the duration, so that’s not well-tested I realized. So I ran such an artificial test.
Long story short: I have some optimizing to do if I’m gong to support high-density data like that in TWO. I haven’t managed to make it crash in the process, but it does get unresponsive on my PC when there’s about 350.000 messages in a Timeline clip recording over 15 mins. I have some ideas I’ve been wanting to implement which will ameliorate this, but in the meanwhile, the solution is to keep the data-rate lower.
Edit: regarding the bug I mentioned and then edited out - it was no bug, I blame it on my Covid brain…
Sorry to hear about the Covid! Feel better soon!
I managed to record short files with both the timeline and the recorder, but when the file is saved it can’t be reopened!
1 Like