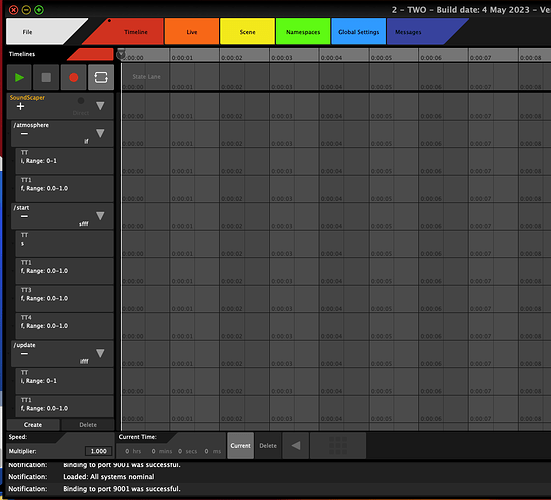
This crash occurred in TWO Timeline when recording Processing example input for SoundScaper and then clicking “Stop” recording button.
Translated Report (Full Report Below)
Process: TWO [2518]
Path: /Applications/OSC/*/TWO.app/Contents/MacOS/TWO
Identifier: com.coma.TWO
Version: 0.9.22 (0.9.22)
Code Type: X86-64 (Native)
Parent Process: launchd [1]
User ID: 501
Date/Time: 2023-05-25 12:31:00.0758 -0400
OS Version: macOS 13.4 (22F66)
Report Version: 12
Bridge OS Version: 7.5 (20P5058)
Anonymous UUID: 5DA32F41-9A4A-D1E9-637E-C13022A64D1E
Time Awake Since Boot: 6100 seconds
System Integrity Protection: enabled
Crashed Thread: 0 JUCE Message Thread Dispatch queue: com.apple.main-thread
Exception Type: EXC_BAD_ACCESS (SIGSEGV)
Exception Codes: KERN_INVALID_ADDRESS at 0x0000000000000040
Exception Codes: 0x0000000000000001, 0x0000000000000040
Termination Reason: Namespace SIGNAL, Code 11 Segmentation fault: 11
Terminating Process: exc handler [2518]
VM Region Info: 0x40 is not in any region. Bytes before following region: 140737486983104
REGION TYPE START - END [ VSIZE] PRT/MAX SHRMOD REGION DETAIL
UNUSED SPACE AT START
—>
shared memory 7fffffeb1000-7fffffeb2000 [ 4K] r-x/r-x SM=SHM
ID Vend/Dev
9a46 687f1002
Seconds Ago ID Type
6100.0 9a46 Attach
Thread 0 Crashed:: JUCE Message Thread Dispatch queue: com.apple.main-thread
0 TWO 0x1041e08af 0x103ee6000 + 3123375
1 TWO 0x1041dfe8a 0x103ee6000 + 3120778
2 TWO 0x1041a13a1 0x103ee6000 + 2864033
3 TWO 0x10416d643 0x103ee6000 + 2651715
4 TWO 0x1041dff98 0x103ee6000 + 3121048
5 TWO 0x10411d184 0x103ee6000 + 2322820
6 CoreFoundation 0x7ff812388f2a CFRUNLOOP_IS_CALLING_OUT_TO_A_SOURCE0_PERFORM_FUNCTION + 17
7 CoreFoundation 0x7ff812388ecc __CFRunLoopDoSource0 + 157
8 CoreFoundation 0x7ff812388ca5 __CFRunLoopDoSources0 + 217
9 CoreFoundation 0x7ff81238792f __CFRunLoopRun + 916
10 CoreFoundation 0x7ff812386f31 CFRunLoopRunSpecific + 560
11 HIToolbox 0x7ff81be02dad RunCurrentEventLoopInMode + 292
12 HIToolbox 0x7ff81be02bbe ReceiveNextEventCommon + 657
13 HIToolbox 0x7ff81be02918 _BlockUntilNextEventMatchingListInModeWithFilter + 64
14 AppKit 0x7ff81541b5d0 _DPSNextEvent + 858
15 AppKit 0x7ff81541a47a -[NSApplication(NSEvent) _nextEventMatchingEventMask:untilDate:inMode:dequeue:] + 1214
16 AppKit 0x7ff81540cae8 -[NSApplication run] + 586
17 TWO 0x1040be87c 0x103ee6000 + 1935484
18 dyld 0x7ff811f5341f start + 1903
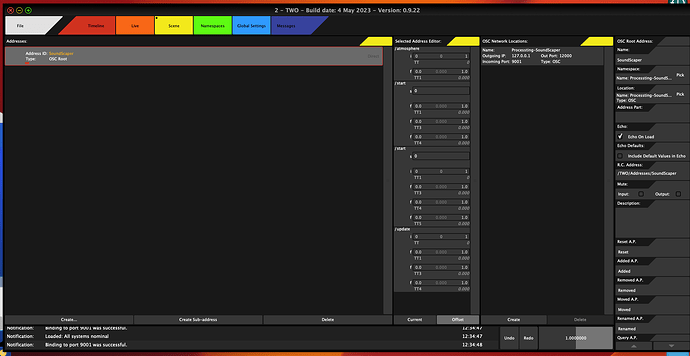
and screenshot of the Scene settings at time of above crash
And this crash, similar to that previously reported when recording on Timeline, but here using the Recording Controller it crashed when record was pressed.
Translated Report (Full Report Below)
Process: TWO [2579]
Path: /Applications/OSC/*/TWO.app/Contents/MacOS/TWO
Identifier: com.coma.TWO
Version: 0.9.22 (0.9.22)
Code Type: X86-64 (Native)
Parent Process: launchd [1]
User ID: 501
Date/Time: 2023-05-25 12:40:13.3184 -0400
OS Version: macOS 13.4 (22F66)
Report Version: 12
Bridge OS Version: 7.5 (20P5058)
Anonymous UUID: 5DA32F41-9A4A-D1E9-637E-C13022A64D1E
Time Awake Since Boot: 6700 seconds
System Integrity Protection: enabled
Crashed Thread: 1 Mediator Thread
Exception Type: EXC_BAD_ACCESS (SIGBUS)
Exception Codes: KERN_PROTECTION_FAILURE at 0x000070000c0f7ff8
Exception Codes: 0x0000000000000002, 0x000070000c0f7ff8
Termination Reason: Namespace SIGNAL, Code 10 Bus error: 10
Terminating Process: exc handler [2579]
VM Region Info: 0x70000c0f7ff8 is in 0x70000c0f7000-0x70000c0f8000; bytes after start: 4088 bytes before end: 7
REGION TYPE START - END [ VSIZE] PRT/MAX SHRMOD REGION DETAIL
Stack 70000bff2000-70000c074000 [ 520K] rw-/rwx SM=PRV thread 7
GAP OF 0x83000 BYTES
—> STACK GUARD 70000c0f7000-70000c0f8000 [ 4K] —/rwx SM=NUL … for thread 1
Stack 70000c0f8000-70000c17a000 [ 520K] rw-/rwx SM=PRV thread 1
ID Vend/Dev
9a46 687f1002
Seconds Ago ID Type
6700.0 9a46 Attach
Thread 0:: JUCE Message Thread Dispatch queue: com.apple.main-thread
0 libsystem_kernel.dylib 0x7ff812270882 __psynch_mutexwait + 10
1 libsystem_pthread.dylib 0x7ff8122aab14 _pthread_mutex_firstfit_lock_wait + 76
2 libsystem_pthread.dylib 0x7ff8122a8921 _pthread_mutex_firstfit_lock_slow + 214
3 TWO 0x100400bc4 0x1002be000 + 1321924
4 TWO 0x100346d0c 0x1002be000 + 560396
5 TWO 0x1004f7922 0x1002be000 + 2332962
6 TWO 0x1004f5184 0x1002be000 + 2322820
7 CoreFoundation 0x7ff812388f2a CFRUNLOOP_IS_CALLING_OUT_TO_A_SOURCE0_PERFORM_FUNCTION + 17
8 CoreFoundation 0x7ff812388ecc __CFRunLoopDoSource0 + 157
9 CoreFoundation 0x7ff812388ca5 __CFRunLoopDoSources0 + 217
10 CoreFoundation 0x7ff81238792f __CFRunLoopRun + 916
11 CoreFoundation 0x7ff812386f31 CFRunLoopRunSpecific + 560
12 HIToolbox 0x7ff81be02dad RunCurrentEventLoopInMode + 292
13 HIToolbox 0x7ff81be02bbe ReceiveNextEventCommon + 657
14 HIToolbox 0x7ff81be02918 _BlockUntilNextEventMatchingListInModeWithFilter + 64
15 AppKit 0x7ff81541b5d0 _DPSNextEvent + 858
16 AppKit 0x7ff81541a47a -[NSApplication(NSEvent) _nextEventMatchingEventMask:untilDate:inMode:dequeue:] + 1214
17 AppKit 0x7ff81540cae8 -[NSApplication run] + 586
18 TWO 0x10049687c 0x1002be000 + 1935484
19 dyld 0x7ff811f5341f start + 1903
1 Like
I’m grateful for these!
It’s an issue I thought I fixed very recently actually…
I’ll look into it again!
Most likely it is because of the unusually high data-rate of the processing programs - that’s how this crash happened last time around, reported by another user a few weeks ago.
A very likely workaround in the meanwhile, is to record without all the “editing lanes” visible. The data is still there even if you remove / collapse those, so that only top-level lanes appear.
Best,
Ilias B.
Could you tell me which of the Processing examples you use?
Because the SimpleMovement one for example, produces a very high amount of messages - in 10 seconds it’s ~6500 individual messages. TWO will possibly run out of memory trying to record anything longer with that huge amount of messages, which may be what you’re seeing.
For this sort of case, I have considered adding rate-limiting at the input and output of TWO, but this isn’t implemented yet, so the only solution is to use data sources which do not produce this high amount of messages.
A typical control message rate is 30hz, which means max 300 messages in 10 seconds, not 20 times that.
With the GUI displaying all editing components for all those individual messages, I tried recording a minute-long clip to see the effect to TWO’s RAM usage. It’s at around 3GB of RAM with a zoomed out view showing all those little controls for the individual values - definitely not a use case I designed it for as it stands.
TWO can still be used for e.g. re-routing these messages without problem, but recording and playback will not be usable as it stands - SoundScaper needs to change its OSC API for that to be tenable.
Meanwhile, I’ll still use it to try to reproduce the crash you had, which of course it is useful for :). I haven’t managed yet though. I’m on Windows, are you running on macOS?
Best,
Ilias B.
I’ve read through the processing code - I see that while the framerate in processing is set to 60, it uses the same message for each of the sounds, “/update”.
Then, the first value, is the index of the sound, meaning the position for all sounds appears recorded in a single lane, rather than having a lane for each, which would have been the case if the messages were not:
/update index X Y Z
But:
/update/1 X Y Z
/update/2 X Y Z
etc…
Meaning that you could view and edit the “keyframes” for each sound in its own lane.
In other words, the way the OSC API of SoundScaper is made, I don’t see it being useable with any OSC timeline application, not only TWO.
I’ll post this on the GitHub of SoundScaper in case the dev is interested in addressing this!
Thanks @iliasb for the great sleuthing work.
I’ll bet that the 2 crash issues I’ve reported are the result, as you’ve suggested, of overloading memory with the very high volume of messages captured in the same “lane” (TWO) of the OSC address due to SoundScaper’s messaging scheme.
I WAS finally able to get SoundScaper’s “SimpleAtmosphereFade.pde” script to generate messages recorded successfully by TWO without crashing TWO. Then I was able to do some port switching and use the recorded clip to control SoundScaper. However, this was a very short recording!
SoundScaper’s “SimpleAtmosphereFade.pde” /atmosphere messaging scheme seems to suffer from the same problem as the /update address, i.e. it would be better to make it something like:
‘atmosphere1/update’
And yes, having a rate-limiter safety option in TWO could be quite valuable, given that TWO can’t tell other apps how to best design their OSC addressing schemes.
I’m on Mac (Intel) Ventura 13.4 (the latest OS release).
I’m OK with our closing the 2 crash bug issues.
1 Like

